
Lesson 3 of 4
Look at the spread before drawing a conclusion
A single number hides the spread
A median of 8 minutes sounds reassuring. A mean of 12 suggests a longer wait. Neither reveals that four visits took between 4 and 10 minutes while one took 32 minutes.
By the end of this lesson, you will be able to read the spread in a chart and distinguish checking an unusual value from conveniently discarding an inconvenient result.
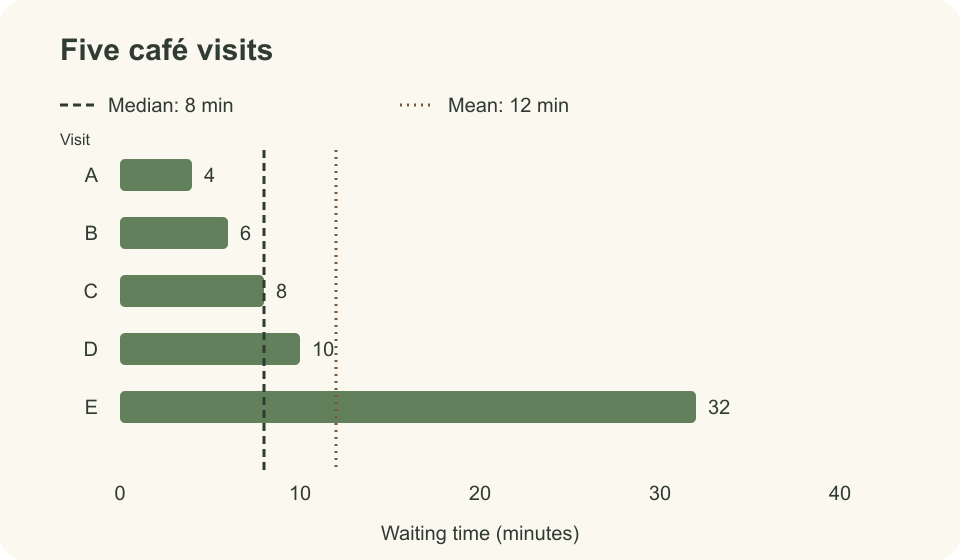
How do you read this chart?
Bar length represents waiting time, and the horizontal axis has a unit: minutes. A shared starting point at zero makes length comparisons honest. Bar E is eight times as long as A because 32 / 4 = 8. The vertical reference lines represent the median and mean, not additional observations.
| Visit | Minutes | Position relative to the 8-minute median |
|---|---|---|
| A | 4 | Below |
| B | 6 | Below |
| C | 8 | Equal |
| D | 10 | Above |
| E | 32 | Above |
The table provides the same values as the bars. You do not need to distinguish colours or read the image to understand the data.
The simplest measure of spread is the range: the difference between the largest and smallest values.
Enable JavaScript to display this block. Its source is shown below.
R=x_{\max}-x_{\min}=32-4=28\;\text{min}Here, R is the range. It is not an average distance from the mean, and it does not describe where most observations lie. It depends only on the two extreme values.
Is 32 minutes a mistake?
The number alone cannot tell us. Someone might have entered 32 instead of 3.2, stopped the timer after drinking the coffee, or genuinely encountered a long queue. In this course, we treat 32 as a valid measurement under the agreed rule. “Unusual value” is a description here, not the result of a formal statistical test.
You can calculate the result without that visit as a sensitivity analysis. The mean falls from 12 to 7 minutes. This experiment shows the observation's influence; it does not justify removing it from the main result.
Try it yourself
Someone reports only the median of 8 minutes and says, “Every visit will fit into a ten-minute break.” What is wrong? Write one more honest sentence.
Compare your answer
The median is not an upper limit on waiting time. One of the five visits took 32 minutes. For example: “Across these five measurements, the median was 8 minutes; four visits took at most 10 minutes, and one took 32. This does not guarantee the length of the next visit.”
Take this forward: show the spread alongside a measure of the centre. Investigate unusual observations, but do not remove them merely because they spoil a convenient story.
Your progress
Finished studying? Mark this lesson complete when you are ready.